SGEMM 单精度矩阵乘法

【CUDA】Sgemm单精度矩阵乘法(已完结~)

问题定义

SGEMM(单精度矩阵乘法)是指在单精度浮点数上下进行的矩阵乘法运算。

设矩阵均为 row-major:

$$
C_{M\times N}=A_{M\times K}B_{K\times N}
$$

其中:

$$
C_{ij}=\sum_{k=0}^{K-1}A_{ik}B_{kj}
$$

一个 SGEMM 一共大约执行:$2MNK$次 FLOP,因为每个 a*b+c 可以视为:

  • 1 次乘法
  • 1 次加法

例如:

1
M=N=K=4096

总计算量:

$$
2\times4096^3\approx137.4\text{ GFLOP}
$$

假设 kernel 执行 1 ms

$$
Performance=\frac{137.4GFLOP}{0.001s}=137.4TFLOPS
$$

因此之后测性能统一使用:

1
gflops = 2.0 * M * N * K / time_seconds / 1e9;

如何才能使得性能最大化,这是首要问题。

代码框架

1
2
3
4
5
6
7
8
9
10
11
12
13
14
15
16
17
18
19
20
21
22
23
24
25
26
27
28
29
30
31
32
33
34
35
36
37
38
39
40
41
42
43
44
45
46
47
48
49
50
51
52
53
54
55
56
57
58
59
60
61
62
63
64
65
66
67
68
69
70
71
72
73
74
75
76
77
78
79
80
81
82
83
84
85
86
87
88
89
90
91
92
93
94
95
96
97
98
99
100
101
102
103
104
105
106
107
108
109
110
111
112
#include <cmath>
#include <algorithm>
#include <cstring>
#include <cstdlib>
#include <stdio.h>
#include<cuda_runtime.h>
#define A(i,j) a[(i)*n+(j)]

void random_matrix(int m,int n,float*a)
{
for(int i=0;i<m;i++)
for(int j=0;j<n;j++)
#if 1
A(i,j) = 2.0*(float)drand48()-1.0;//drand48() 产生 [0.0, 1.0) 的随机数
#else
A(i,j)=(j-i)%3;
#endif
}

float check(int m,int n,float *a,float *b)
{
float max_diff = 0.0,diff=0.0;
for(int i=0;i<m;i++)
{
for(int j=0;j<n;j++)
{
diff = abs(a[i*n+j]-b[i*n+j]);
max_diff = max(max_diff,diff);
if(max_diff>0.05f)
{
printf("\n error\n");
return max_diff;
}
}
}
return max_diff;
}
void cpu_sgemm(float *A_ptr,float *B_ptr, float *C_ptr,const int M, const int N ,const int K) // M*K K*N M*N
{
//遍历结果矩阵的每一个元素
for(int i=0;i<M;i++)
{
for(int j=0;j<N;j++)
{
for(int idx=0;idx<K;idx++)
{
C_ptr[i*N+j]+=A_ptr[i*K+idx]*B_ptr[idx*N+j];
}
}
}
return ;
}
//block size 16 * 16
__global__ void cuda_sgemm(
float *A,float *B,float *C,
const int m,const int n,const int k)
{
}


int main()
{
const int m = 1000;
const int n = 1300;
const int k = 700;
const size_t mem_size_A = m * k * sizeof(float);
const size_t mem_size_B = k * n * sizeof(float);
const size_t mem_size_C = m * n * sizeof(float);

float *matrix_A_host = (float*)malloc(mem_size_A);
float *matrix_B_host = (float*)malloc(mem_size_B);

float *matrix_C_host_gpu_calc = (float*)malloc(mem_size_C);
float *matrix_C_host_cpu_calc = (float*)malloc(mem_size_C);

//随机初始化矩阵
random_matrix(m,k,matrix_A_host);
random_matrix(k,n,matrix_B_host);
memset(matrix_C_host_cpu_calc,0,mem_size_C);
memset(matrix_C_host_gpu_calc,0,mem_size_C);

float *matrix_A_device,*matrix_B_device,*matrix_C_device;
cudaMalloc((void**)&matrix_A_device,mem_size_A);
cudaMalloc((void**)&matrix_B_device,mem_size_B);
cudaMalloc((void**)&matrix_C_device,mem_size_C);

cudaMemcpy(matrix_A_device,matrix_A_host,mem_size_A,cudaMemcpyHostToDevice);
cudaMemcpy(matrix_B_device,matrix_B_host,mem_size_B,cudaMemcpyHostToDevice);

cpu_sgemm(matrix_A_host,matrix_B_host,matrix_C_host_cpu_calc,m,n,k);

constexpr int BLOCK = 16;
dim3 block(BLOCK,BLOCK);
dim3 grid((n+BLOCK-1)/BLOCK,(m+BLOCK-1)/BLOCK);
cuda_sgemm<<<grid,block>>>(matrix_A_device,matrix_B_device,matrix_C_device,m,n,k);

cudaMemcpy(matrix_C_host_gpu_calc,matrix_C_device,mem_size_C,cudaMemcpyDeviceToHost);

float diff = check(m,n,matrix_C_host_cpu_calc,matrix_C_host_gpu_calc);

free(matrix_A_host);
free(matrix_B_host);
free(matrix_C_host_cpu_calc);
free(matrix_C_host_gpu_calc);

cudaFree(matrix_A_device);
cudaFree(matrix_B_device);
cudaFree(matrix_C_device);

return 0;
}

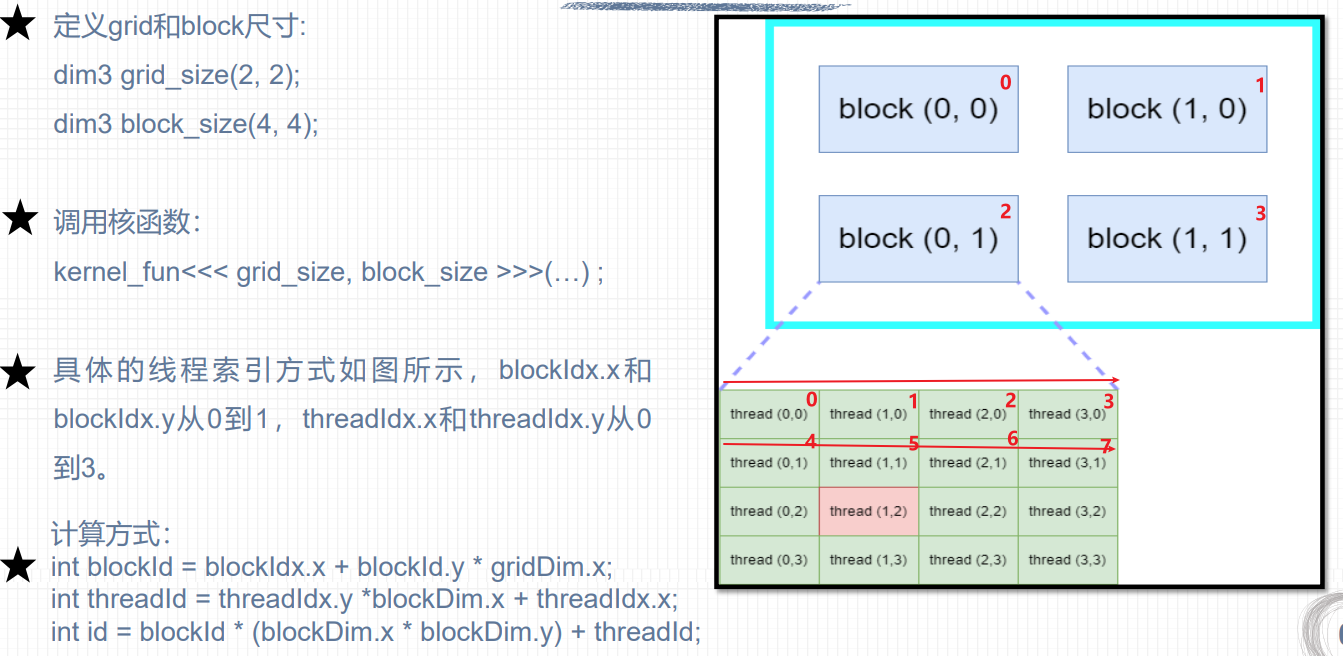
二维网格 二维线程块

image-1786687726517.png

分析思路

1
2
3
4
5
6
7
8
9
10
11
12
13
14
15
16
17
18
19
20
21
22
23
24
25
26
27
28
29
30
31
32
33
34
35
36
37
38
39
                  Duration / TFLOPS


Speed Of Light

┌─────────────┴─────────────┐
▼ ▼
Compute Memory
│ │
Issue Slots Busy DRAM Throughput
SM Busy L2 Throughput
IPC L1/TEX Throughput
│ Mem Busy
│ Max Bandwidth
│ Mem Pipes Busy
│ │
└─────────────┬─────────────┘

Occupancy

Active Warps够吗


Scheduler

Active → Eligible → Issued

Eligible太少?


Warp Stall

┌──────────────┼───────────────┐
▼ ▼ ▼
Short Scoreboard MIO Throttle Barrier
Shared依赖 MIO压力 同步等待

Long Scoreboard Math Throttle Not Selected
Global/L1TEX 数学pipe压力 warp很多
层级 类别 指标 / 概念 中文解释 含义 / 诊断价值
第一层 顶层入口 Duration / TFLOPS 程序运行总时间 / 理论浮点性能 宏观入口,通过与理论峰值对比,判断内核整体性能表现。
顶层分支 Speed Of Light 光速(理论性能峰值) 当前GPU架构的理论计算或内存性能上限,用于衡量程序与峰值的差距。
第二层 计算路径 (Compute) Issue Slots Busy 发射槽位忙碌率 每个周期Warp调度器发射指令的槽位被使用的百分比。低值说明调度器空转严重。
SM Busy SM(流式多处理器)忙碌率 SM处于活跃状态(非空闲)的时间百分比。低值说明计算资源未被充分利用。
IPC 每周期指令数 每个周期平均执行的指令数,直接反映计算吞吐量。
内存路径 (Memory) DRAM / L2 / L1/TEX Throughput 各级内存吞吐量 数据通过显存、二级缓存、一级/纹理缓存的传输速率,通常以峰值百分比表示。
Mem Busy 内存总线忙碌率 内存总线处于忙碌状态的时间百分比。
Max Bandwidth 最大带宽利用率 当前内存吞吐量占理论最大带宽的百分比。若此指标高,程序为内存受限。
Mem Pipes Busy 内存管道忙碌率 执行内存指令的流水线被利用的程度。
第三层 占用率与调度 Occupancy 占用率 每个SM上实际活跃Warp数与最大可能数量的比率,是隐藏延迟的前提。
Active Warps 活跃线程束 当前在SM上处于活动状态的Warp数量。
Scheduler 调度器 每个周期从就绪的Warp中选择一个来发射指令的硬件单元。
Active → Eligible → Issued 活跃 → 就绪 → 发射 指令发射路径。Warp必须同时活跃且就绪(Eligible)才会被选中发射。
Eligible 太少? 就绪线程束过少 若大量周期无就绪Warp,说明程序为延迟受限,需分析具体停顿原因。
第四层 Warp Stall (停顿原因) Short Scoreboard 短记分板停顿 等待短延迟不离开SM的指令结果,如共享内存访问、特殊数学指令。
Long Scoreboard 长记分板停顿 等待长延迟可能离开SM的指令结果,如全局/局部内存访问。
MIO Throttle MIO节流停顿 MIO单元(含共享内存、特殊数学指令)的指令队列已满,无法继续发射。
Math Throttle 数学节流停顿 数学计算管道(如FMA、Tensor Core)的指令队列已满,无法继续发射。
Barrier 屏障等待 Warp在显式同步点(如__syncthreads())上等待其他Warp。
Not Selected 未被选中停顿 Warp本身就绪,但当前周期未被调度器选中,常因活跃Warp过多导致竞争。
  1. 自上而下定位:先从Speed Of Light判断是计算还是内存瓶颈。
  2. 深入分析:若计算/内存指标异常(如IPC低或带宽满),则进入OccupancyScheduler层。
  3. 根因诊断:若发现Eligible Warp过少,则在Warp Stall原因中查找对应的高频停顿项(如Long Scoreboard),并针对性优化(如合并内存访问、减少同步等)。

00-朴素实现

代码思路

和cpu计算方式一样,不考虑其他问题。

代码

1
2
3
4
5
6
7
8
9
10
11
12
13
__global__  void  cuda_sgemm_naive(
float *A,float *B,float *C,
const int m,const int n,const int k)
{
int col = blockIdx.x * blockDim.x + threadIdx.x;
int row = blockIdx.y * blockDim.y + threadIdx.y;
if(row>=m||col>=n) return;
for(int idx=0;idx<k;idx++)
{
C[row*n+col]+= A[row*k+idx]*B[idx*n+col];
}
return ;
}

性能分析

1
2
ncu  --section SpeedOfLight   --section MemoryWorkloadAnalysis   --section Lau
nchStats --section Occupancy ./sgemm
1
2
3
4
5
6
7
8
9
10
11
12
13
14
15
16
17
18
19
20
21
22
23
24
25
26
27
28
29
30
31
32
33
34
35
36
37
38
39
40
41
42
43
44
45
46
47
48
49
50
51
52
53
54
55
56
57
58
59
60
61
62
63
64
65
66
67
68
69
70
71
72
73
74
75
76
77
78
79
80
81
cuda_sgemm_naive(float *, float *, float *, int, int, int) (128, 128, 1)x(16, 16, 1), Context 1, Stream 7, Device 0, CC 12.0
Section: GPU Speed Of Light Throughput
----------------------- ----------- ------------
Metric Name Metric Unit Metric Value
----------------------- ----------- ------------
DRAM Frequency Ghz 13.79
SM Frequency Ghz 2.01
Elapsed Cycles cycle 6,639,972
Memory Throughput % 95.35
DRAM Throughput % 0.86
Duration ms 3.30
L1/TEX Cache Throughput % 96.00
L2 Cache Throughput % 35.85
SM Active Cycles cycle 6,585,895.82
Compute (SM) Throughput % 95.35
----------------------- ----------- ------------

INF This workload is utilizing greater than 80.0% of the available compute or memory performance of the device.
To further improve performance, work will likely need to be shifted from the most utilized to another unit.
Start by analyzing workloads in the Compute Workload Analysis section.

Section: Memory Workload Analysis
-------------------------------------- ----------- ------------
Metric Name Metric Unit Metric Value
-------------------------------------- ----------- ------------
Local Memory Spilling Requests no data
Local Memory Spilling Request Overhead % no data
Memory Throughput Gbyte/s 15.25
Mem Busy % 71.54
Max Bandwidth % 95.35
L1/TEX Hit Rate % 87.27
L2 Persisting Size Mbyte 18.87
L2 Compression Success Rate % 0
L2 Compression Ratio 0
L2 Compression Input Sectors sector 0
L2 Hit Rate % 98.88
Mem Pipes Busy % 95.35
-------------------------------------- ----------- ------------

Section: Launch Statistics
-------------------------------- --------------- ---------------
Metric Name Metric Unit Metric Value
-------------------------------- --------------- ---------------
Block Size 256
Cluster Scheduling Policy PolicySpread
Cluster Size 0
Function Cache Configuration CachePreferNone
Grid Size 16,384
Preferred Cluster Size 0
Registers Per Thread register/thread 40
Shared Memory Configuration Size Kbyte 16.38
Driver Shared Memory Per Block Kbyte/block 1.02
Dynamic Shared Memory Per Block byte/block 0
Static Shared Memory Per Block byte/block 0
# SMs SM 170
Stack Size 1,024
Threads thread 4,194,304
# TPCs 85
Enabled TPC IDs all
Uses Green Context 0
Waves Per SM 16.06
-------------------------------- --------------- ---------------

Section: Occupancy
------------------------------- ----------- ------------
Metric Name Metric Unit Metric Value
------------------------------- ----------- ------------
Max Active Clusters cluster 0
Max Cluster Size block 8
Overall GPU Occupancy % 0
Cluster Occupancy % 0
Block Limit Barriers block 24
Block Limit SM block 24
Block Limit Registers block 6
Block Limit Shared Mem block 16
Block Limit Warps block 6
Theoretical Active Warps per SM warp 48
Theoretical Occupancy % 100
Achieved Occupancy % 97.46
Achieved Active Warps Per SM warp 46.78
------------------------------- ----------- ------------

Step1-Speed Of Light Throughput

判断瓶颈方向,内存还是计算?

1
2
3
Memory Throughput                 %        95.35
DRAM Throughput % 0.86
Compute (SM) Throughput % 95.35
  • Compute Throughput:计算单元的忙碌程度
  • Memory Throughput :内存系统中所有部件工作负载最大值
  • DRAM Throughput:访问显存的压力

结论:GPU计算单元使用不充分,但是某一级内存系统已经接近满负荷。
下一步:看是哪一级内存引起的,L1?L2?DRAM?

1
2
3
L1/TEX Cache Throughput           %        96.00
L2 Cache Throughput % 35.85
DRAM Throughput % 0.86
1
2
3
4
5
6
7
SM

L1 96.0%

L2 35.9% ← 最忙

DRAM 0.9%

Step2-Memory Workload Analysis

命中率

1
2
L1/TEX Hit Rate                                  %        87.27
L2 Hit Rate % 98.88

可以发现,L2收到的请求,L2基本都可以找到,说明大量访存需求在L2这一层完成,导致L2的负载很大,而DRAM的负载很小。

Step3-kernel code Analysis

分析代码可以得到:

  1. 一个线程负责答案矩阵C中的一个元素计算
  2. 一个线程需要访问A的一行和B的一列
  3. sum存放在寄存器中,计算工程中线程不断对自己的寄存器内容累加。
  4. 循环结束后,线程访问C,写入答案
    数据路径:
1
2
3
4
5
6
7
8
9
A/B

Global Memory / Cache

Register

FMA

sum register

问题

对于同一个block($16 \times 16$)的线程,如线程$(0,0)$和线程$(1,0)$,它们的$row$是相同的,线程$(0,0)$和线程$(0,1)$,它们的$col$是相同的。也就是说,一个block中的线程们会重复访问A和B的数据
即:

  • 矩阵$A$的一行数据被同一行的多个线程重复使用
  • 矩阵$B$的一列数据被同一列的多个线程重复使用
    但我们当前的代码没有利用这个性质,只是粗鲁地进行一次又一次的访问然后在L2命中,使得L2负载很高。
    因此,瓶颈在于:L2/request traffic bound,warp一直在等待数据

优化方向

一个从 Global Memory 加载进来的 A/B 元素,要让多个线程重复使用。

01-Shared Memory Tiling

沿着维度$K$分块,计算$C_{tile} = A_{tile} B_{tile}$

保存一个block中重复使用的数据,即A矩阵的tile行,B矩阵的tile列

我的错误想法

1
2
3
4
5
6
7
8
9
10
11
12
13
14
15
16
17
18
19
20
21
22
23
24
25
26
27
28
29
30
31
32
33
34
template<int TILE>
__global__ void sgemm_shared(
float *A,float *B,float *C,
const int m,const int n,const int k)
{
__shared__ float As[TILE*k];
__shared__ float Bs[TILE*k];

int col = blockIdx.x * blockDim.x + threadIdx.x;
int row = blockIdx.y * blockDim.y + threadIdx.y;
if(row>=m||col>=n) return;

if(threadIdx.y==0)
{
for(int i=0;i<k*TILE;i++)
{
As[i] = A[row*k+i];
}
}
if(threadIdx.x==0)
{
for(int i=0;i<k*TILE;i++)
{
Bs[i] = B[i*k+row];
}
}
float sum=0.f;
for(int idx=0;idx<k;idx++)
{
sum+=As[threadIdx.y*k+idx]*Bs[idx*k+threadIdx.x];
}
C[row*n+col]+=sum;
return ;
}

问题:

  1. k 是运行时参数,不能这样编写代码
  2. 使用 dynamic shared memory 实现,TILE*K 也太大,共享内存放不下
  3. 存在重复搬运的问题
    优化:
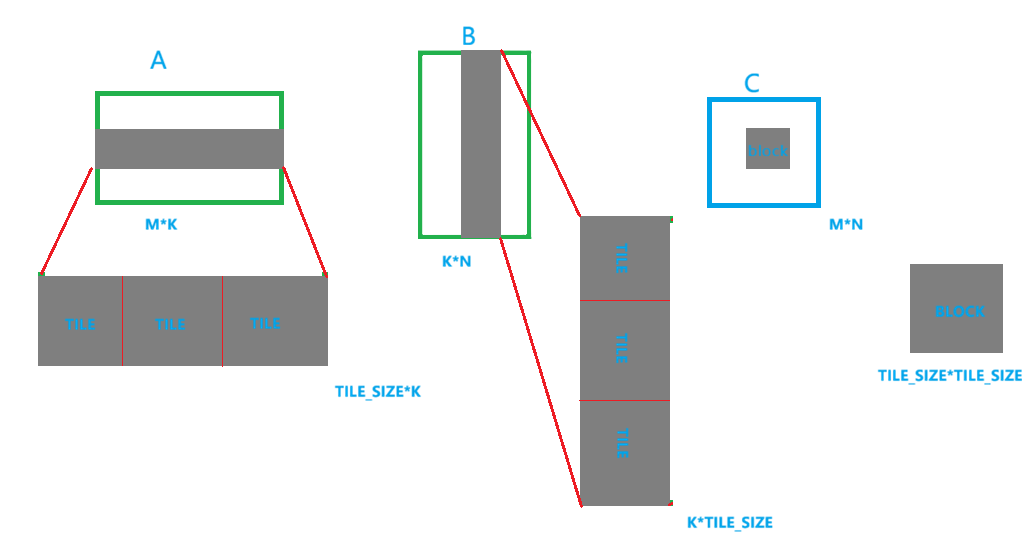
    继续拆分,将$tile\times k$沿着维度k继续分块,即:
1
2
3
4
5
6
7
8
9
C tile
=
A tile 0 × B tile 0
+
A tile 1 × B tile 1
+
A tile 2 × B tile 2
+
A tile 3 × B tile 3

这样处理,既可以减少共享内存的使用,也可以让一个线程每次循环负责搬运一个位置,计算一个位置。image-1786955470796.png
代码

1
2
3
4
5
6
7
8
9
10
11
12
13
14
15
16
17
18
19
20
21
22
23
24
25
26
27
28
29
30
31
32
33
34
35
36
37
38
39
40
template<int TILE>
__global__ void sgemm_shared(
float *A,float *B,float *C,
const int m,const int n,const int k)
{
__shared__ float As[TILE][TILE];
__shared__ float Bs[TILE][TILE];
float sum = 0.f;
int tx = threadIdx.x,ty = threadIdx.y;
int row = ty + blockIdx.y*blockDim.y;
int col = tx + blockIdx.x*blockDim.x;
//每次只考虑一个TILE块
for(int blk=0;blk < (k+TILE-1)/TILE;blk++)//遍历每一块
{


//考虑TILE块
int A_row = row;
int A_col = blk*TILE + tx;
int B_row = blk*TILE + ty;
int B_col = col;

//每个线程负责一个元素的搬运
if(A_row < m && A_col < k)As[ty][tx] = A[A_row*k+A_col];
else As[ty][tx] = 0.f;

if(B_row < k && B_col < n)Bs[ty][tx] = B[B_row*n+B_col];
else Bs[ty][tx] =0.f;
__syncthreads();

//计算
for(int i=0;i<TILE;i++)
{
sum += As[ty][i]*Bs[i][tx];
}
__syncthreads();
}
//存储
if(row<m&&col<n) C[row*n+col]=sum;
}

更优雅的实现

1
2
3
4
5
6
7
8
9
10
11
12
13
14
15
16
17
18
19
20
21
22
23
24
25
26
27
28
29
30
31
32
33
34
35
36
37
38
39
40
41
42
43
44
45
46
47
48
49
template<int TILE>
__global__ void sgemm_shared(
const float* __restrict__ A,
const float* __restrict__ B,
float* __restrict__ C,
int M, int N, int K)
{
__shared__ float As[TILE][TILE];
__shared__ float Bs[TILE][TILE];

const int tx = threadIdx.x;
const int ty = threadIdx.y;

const int row = blockIdx.y * TILE + ty;
const int col = blockIdx.x * TILE + tx;

float sum = 0.0f;

// 沿 K 维,每次向前移动 TILE
for (int k0 = 0; k0 < K; k0 += TILE)
{
// Global Memory -> Shared Memory
As[ty][tx] =
(row < M && k0 + tx < K)
? A[row * K + k0 + tx]
: 0.0f;

Bs[ty][tx] =
(k0 + ty < K && col < N)
? B[(k0 + ty) * N + col]
: 0.0f;

__syncthreads();

// 当前 tile 对 C[row][col] 的贡献
#pragma unroll
for (int k = 0; k < TILE; ++k)
{
sum += As[ty][k] * Bs[k][tx];
}

__syncthreads();
}

if (row < M && col < N)
{
C[row * N + col] = sum;
}
}

优雅之处:

  1. __restrict__ 告诉编译器这些指针不存在别名关系,有利于编译器优化

性能分析

本次实现由三个阶段组成:

1
2
3
4
5
6
7
8
9
10
11
12
13
14
// 1. Global -> Shared
As[ty][tx] = ...;
Bs[ty][tx] = ...;

__syncthreads();

// 2. Shared -> Register -> FMA
for (int k = 0; k < TILE; ++k)
sum += As[ty][k] * Bs[k][tx];

__syncthreads();

// 3. Register -> Global
C[row * N + col] = sum;

NCU结果:

1
2
3
4
5
6
7
8
9
10
11
12
13
14
15
16
17
18
19
20
21
22
23
24
25
26
27
28
29
30
31
32
33
34
35
36
37
38
39
40
41
42
43
44
45
46
47
48
49
50
51
52
53
54
55
56
57
58
59
60
61
62
63
64
65
66
67
68
69
70
71
72
73
74
75
76
77
78
79
80
81
82
83
84
85
86
87
88
89
90
91
92
93
94
95
96
97
98
99
100
101
102
103
104
105
106
107
108
109
110
111
112
113
114
115
116
117
118
119
120
121
122
123
124
125
126
127
128
129
130
131
132
133
134
135
136
137
138
139
140
141
142
143
144
145
146
147
148
149
150
151
152
153
154
155
156
[3565954] sgemm@127.0.0.1
void sgemm_shared<16>(float *, float *, float *, int, int, int) (128, 128, 1)x(16, 16, 1), Context 1, Stream 7, Device 0, CC 12.0
Section: GPU Speed Of Light Throughput
----------------------- ----------- ------------
Metric Name Metric Unit Metric Value
----------------------- ----------- ------------
DRAM Frequency Ghz 13.79
SM Frequency Ghz 2.01
Elapsed Cycles cycle 4,955,731
Memory Throughput % 96.04
DRAM Throughput % 0.77
Duration ms 2.46
L1/TEX Cache Throughput % 96.65
L2 Cache Throughput % 31.48
SM Active Cycles cycle 4,905,850.17
Compute (SM) Throughput % 96.04
----------------------- ----------- ------------

INF This workload is utilizing greater than 80.0% of the available compute or memory performance of the device.
To further improve performance, work will likely need to be shifted from the most utilized to another unit.
Start by analyzing workloads in the Compute Workload Analysis section.

Section: Compute Workload Analysis
-------------------- ----------- ------------
Metric Name Metric Unit Metric Value
-------------------- ----------- ------------
Executed Ipc Active inst/cycle 1.15
Executed Ipc Elapsed inst/cycle 1.15


Issued Ipc Active inst/cycle 1.15
SM Busy % 36.32
-------------------- ----------- ------------

OPT Est. Local Speedup: 90.39%
All compute pipelines are under-utilized. Either this workload is very small or it doesnt issue enough warps
per scheduler. Check the Launch Statistics and Scheduler Statistics sections for further details.

Section: Memory Workload Analysis
-------------------------------------- ----------- ------------
Metric Name Metric Unit Metric Value
-------------------------------------- ----------- ------------
Local Memory Spilling Requests no data
Local Memory Spilling Request Overhead % no data
Memory Throughput Gbyte/s 13.64
Mem Busy % 61.03
Max Bandwidth % 96.04
L1/TEX Hit Rate % 0.03
L2 Persisting Size Mbyte 18.87
L2 Compression Success Rate % 0
L2 Compression Ratio 0
L2 Compression Input Sectors sector 0
L2 Hit Rate % 99.01
Mem Pipes Busy % 96.04
-------------------------------------- ----------- ------------

Section: Launch Statistics
-------------------------------- --------------- ---------------
Metric Name Metric Unit Metric Value
-------------------------------- --------------- ---------------
Block Size 256
Cluster Scheduling Policy PolicySpread
Cluster Size 0
Function Cache Configuration CachePreferNone
Grid Size 16,384
Preferred Cluster Size 0
Registers Per Thread register/thread 37
Shared Memory Configuration Size Kbyte 65.54
Driver Shared Memory Per Block Kbyte/block 1.02
Dynamic Shared Memory Per Block byte/block 0
Static Shared Memory Per Block Kbyte/block 2.05
# SMs SM 170
Stack Size 1,024
Threads thread 4,194,304
# TPCs 85
Enabled TPC IDs all
Uses Green Context 0
Waves Per SM 16.06
-------------------------------- --------------- ---------------

Section: Occupancy
------------------------------- ----------- ------------
Metric Name Metric Unit Metric Value
------------------------------- ----------- ------------
Max Active Clusters cluster 0
Max Cluster Size block 8
Overall GPU Occupancy % 0
Cluster Occupancy % 0
Block Limit Barriers block 24
Block Limit SM block 24
Block Limit Registers block 6
Block Limit Shared Mem block 21
Block Limit Warps block 6
Theoretical Active Warps per SM warp 48
Theoretical Occupancy % 100
Achieved Occupancy % 97.70
Achieved Active Warps Per SM warp 46.90
------------------------------- ----------- ------------


Section: Scheduler Statistics
---------------------------- ----------- ------------
Metric Name Metric Unit Metric Value
---------------------------- ----------- ------------
One or More Eligible % 28.85
Issued Warp Per Scheduler 0.29
No Eligible % 71.15
Active Warps Per Scheduler warp 11.72
Eligible Warps Per Scheduler warp 1.30
---------------------------- ----------- ------------

OPT Est. Local Speedup: 4.011%
Every scheduler is capable of issuing one instruction per cycle, but for this workload each scheduler only
issues an instruction every 3.5 cycles. This might leave hardware resources underutilized and may lead to
less optimal performance. Out of the maximum of 12 warps per scheduler, this workload allocates an average
of 11.72 active warps per scheduler, but only an average of 1.30 warps were eligible per cycle. Eligible
warps are the subset of active warps that are ready to issue their next instruction. Every cycle with no
eligible warp results in no instruction being issued and the issue slot remains unused. To increase the
number of eligible warps, avoid possible load imbalances due to highly different execution durations per
warp. Reducing stalls indicated on the Warp State Statistics and Source Counters sections can help, too.

Section: Warp State Statistics
---------------------------------------- ----------- ------------
Metric Name Metric Unit Metric Value
---------------------------------------- ----------- ------------
Warp Cycles Per Issued Instruction cycle 40.63
Warp Cycles Per Executed Instruction cycle 40.63
Avg. Active Threads Per Warp 32
Avg. Not Predicated Off Threads Per Warp 32.00
---------------------------------------- ----------- ------------

OPT Est. Speedup: 4.011%
On average, each warp of this workload spends 19.5 cycles being stalled waiting for the MIO (memory
input/output) instruction queue to be not full. This stall reason is high in cases of extreme utilization of
the MIO pipelines, which include special math instructions, dynamic branches, as well as shared memory
instructions. When caused by shared memory accesses, trying to use fewer but wider loads can reduce pipeline
pressure. This stall type represents about 48.0% of the total average of 40.6 cycles between issuing two
instructions.
----- --------------------------------------------------------------------------------------------------------------
INF Check the Warp Stall Sampling (All Samples) table for the top stall locations in your source based on
sampling data. The Profiling Guide
(https://docs.nvidia.com/nsight-compute/ProfilingGuide/index.html#metrics-reference) provides more details
on each stall reason.


Section: Source Counters
------------------------- ----------- ------------
Metric Name Metric Unit Metric Value
------------------------- ----------- ------------
Branch Instructions Ratio % 0.02
Branch Instructions inst 17,170,432
Branch Efficiency % 100
Avg. Divergent Branches branches 0
------------------------- ----------- ------------

Step1-Speed Of Light Throughput

1
2
3
4
5
6
Memory Throughput       96.04%
Compute (SM) Throughput 96.04%

DRAM Throughput 0.77%
L1/TEX Cache Throughput 96.65%
L2 Cache Throughput 31.48%

某个 SM 内部资源已经接近极限

Step2-Compute Workload

1
2
Issue Slots Busy = 28.85% //有多少可用的 instruction issuing 能力真正被利用
SM Busy = 36.32%

并且NCU提示:

1
All compute pipelines are under-utilized

说明FP32 等计算 pipeline 没有充分利用

Step3-Memory Workload

1
2
3
4
5
6
DRAM Throughput    = 0.77%
L2 Hit Rate = 99.01%

Mem Busy = 61.03%
Mem Pipes Busy = 96.04%
Max Bandwidth = 96.04%
  1. DRAM Throughput = 0.77% 说明显存带宽十分空闲
  2. Mem Pipes Busy(发射 memory instruction 的相关 pipeline 有多忙) = 96.04% 说明SM 内部用于处理 memory instruction 的 pipeline 压力非常大

Step4-Occupancy

1
2
3
4
5
6
Theoretical Occupancy = 100%
Achieved Occupancy = 97.70%

Active Warps / SM
理论:48
实际:46.90

可以排除wrap太少导致的pipeline空闲


1
2
3
4
5
6
7
8
Occupancy 97.7%

SM 里有很多 warp

但 Issue Slots Busy 只有 28.85%

很多 warp 虽然 resident,
却没有处于可以立即执行的状态

Step5-Scheduler Statistics

1
2
3
4
Issued Warp Per Scheduler                        0.29
No Eligible % 71.15
Active Warps Per Scheduler warp 11.72
Eligible Warps Per Scheduler warp 1.30//下一条指令已经具备执行条件,可以立即被 scheduler 选择的 warp。

SM中存在很多warp但是真正可以执行的warp很少,这也是Issue Slots Busy = 28.85%的原因,接下来要判断到底是什么原因导致可执行的warp少。

Step6-Warp State Statistics Warp Stall
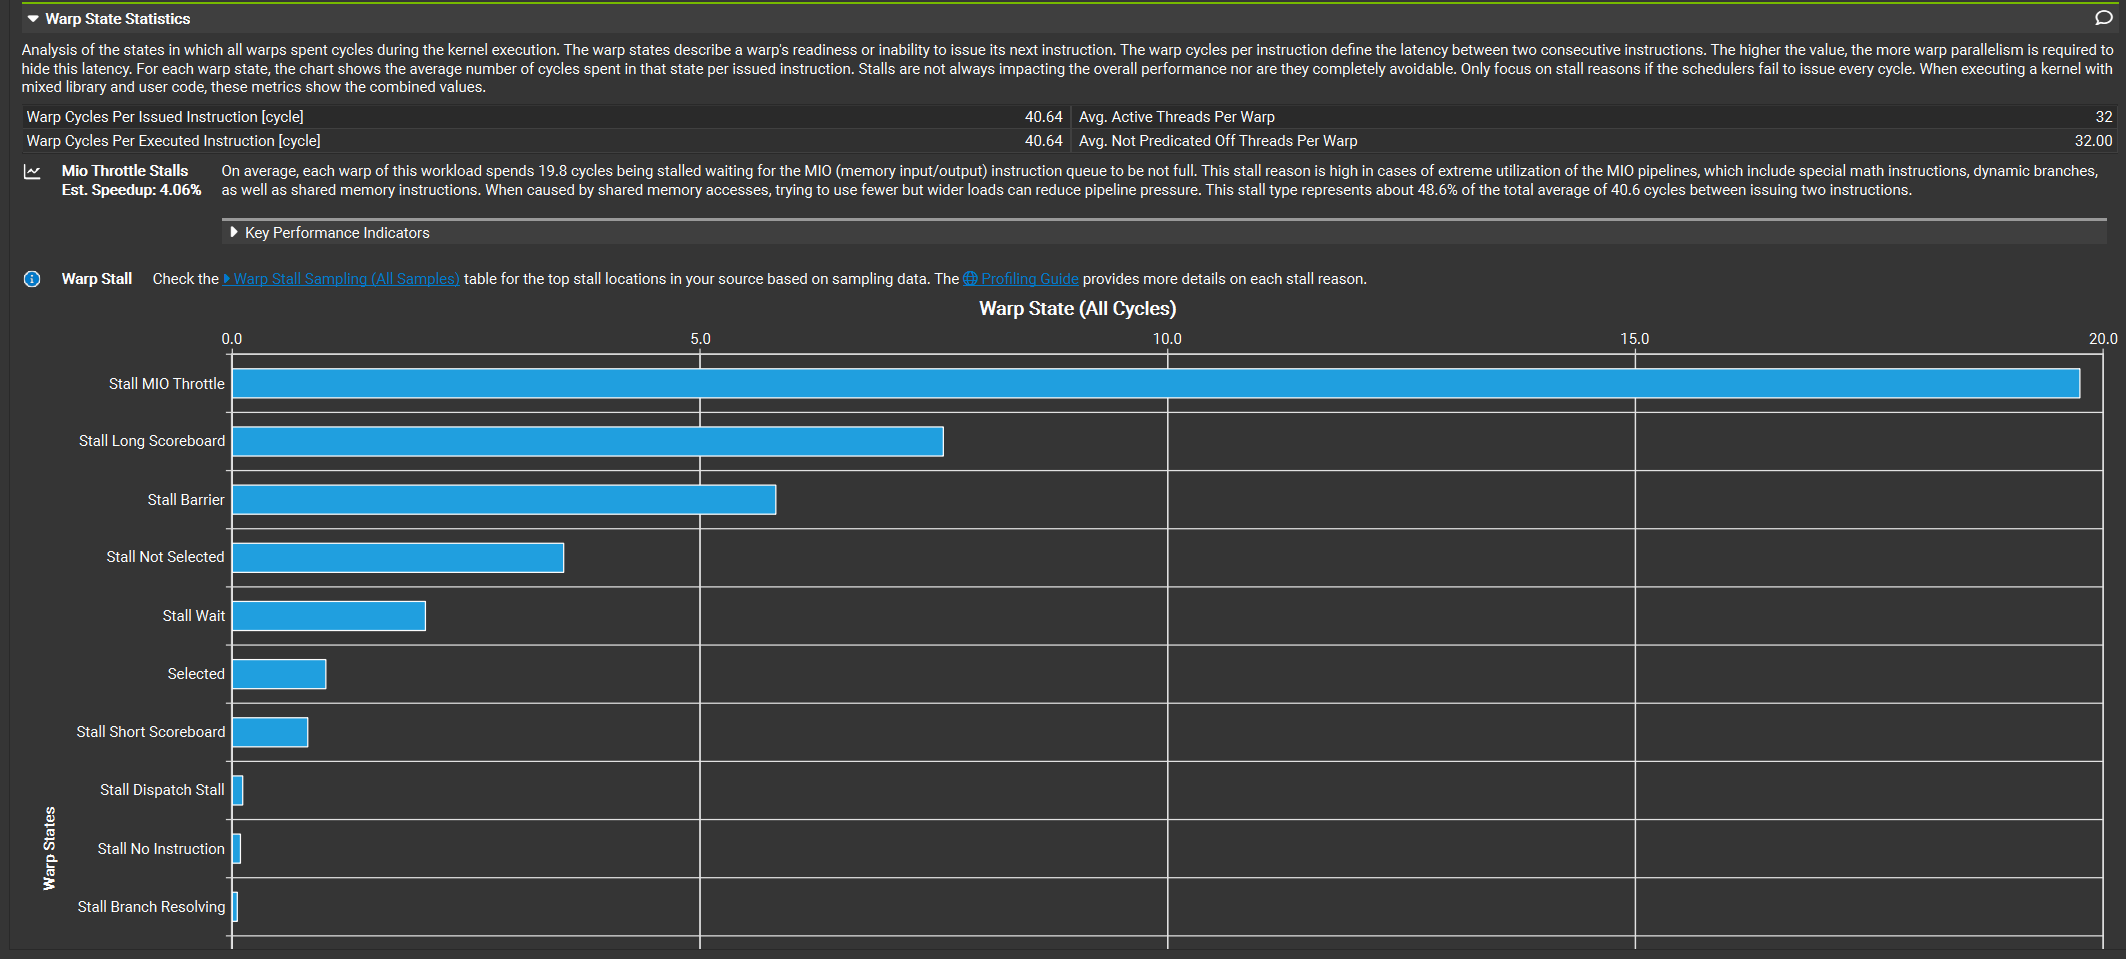
image-1786959241157.png

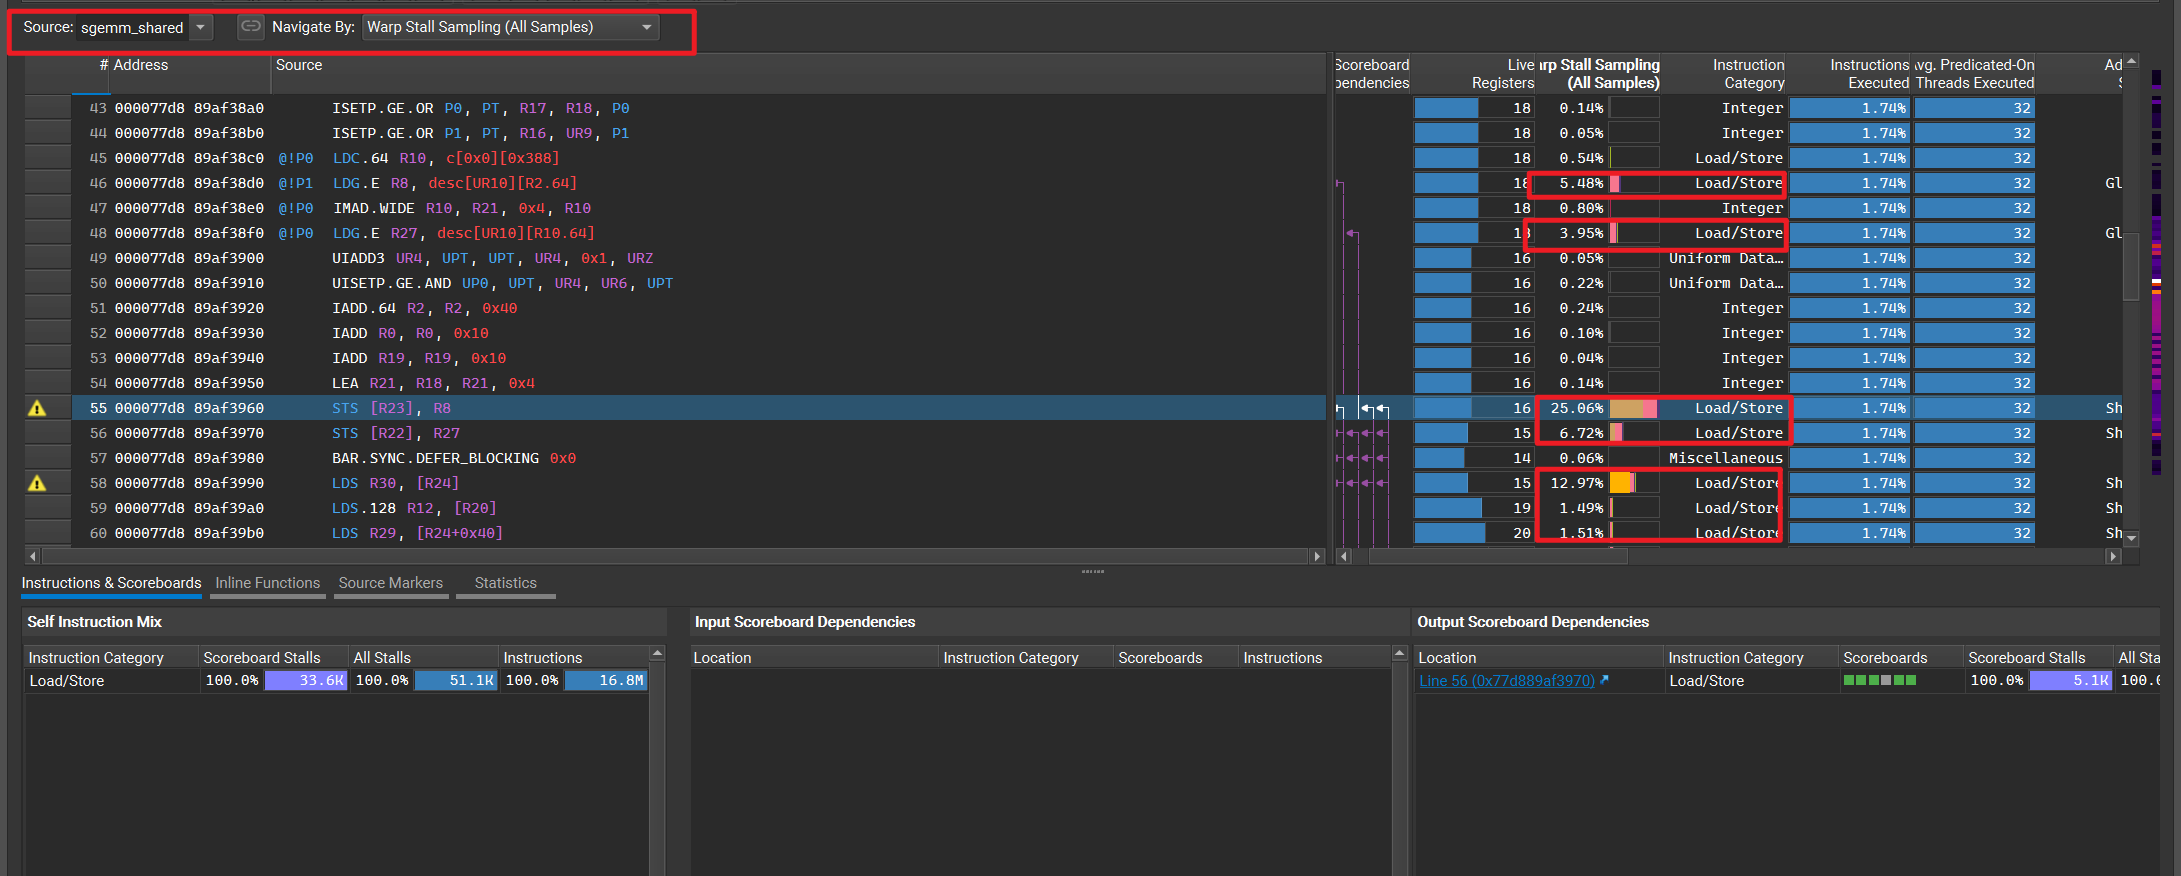
image-1786959893474.png

stall主要在MIO(memeory input output)

综合判断

结合上述和代码可得:

1
2
3
4
5
6
7
大量 shared-memory instruction

MIO queue / memory pipe 很忙

warp 无法继续发 shared load

Eligible warp 减少

问题在于共享内存和寄存器之间的频繁load,导致warp中的线程处于等待状态